Premium
Monitoring after implementation for your team to gain autonomy in the tool.
Premium Details
QualiChart
Organize runs, track analytical performance and document decisions. QualiChart connects statistical monitoring to your team's routine.
The IQC in practice
01 / Active control
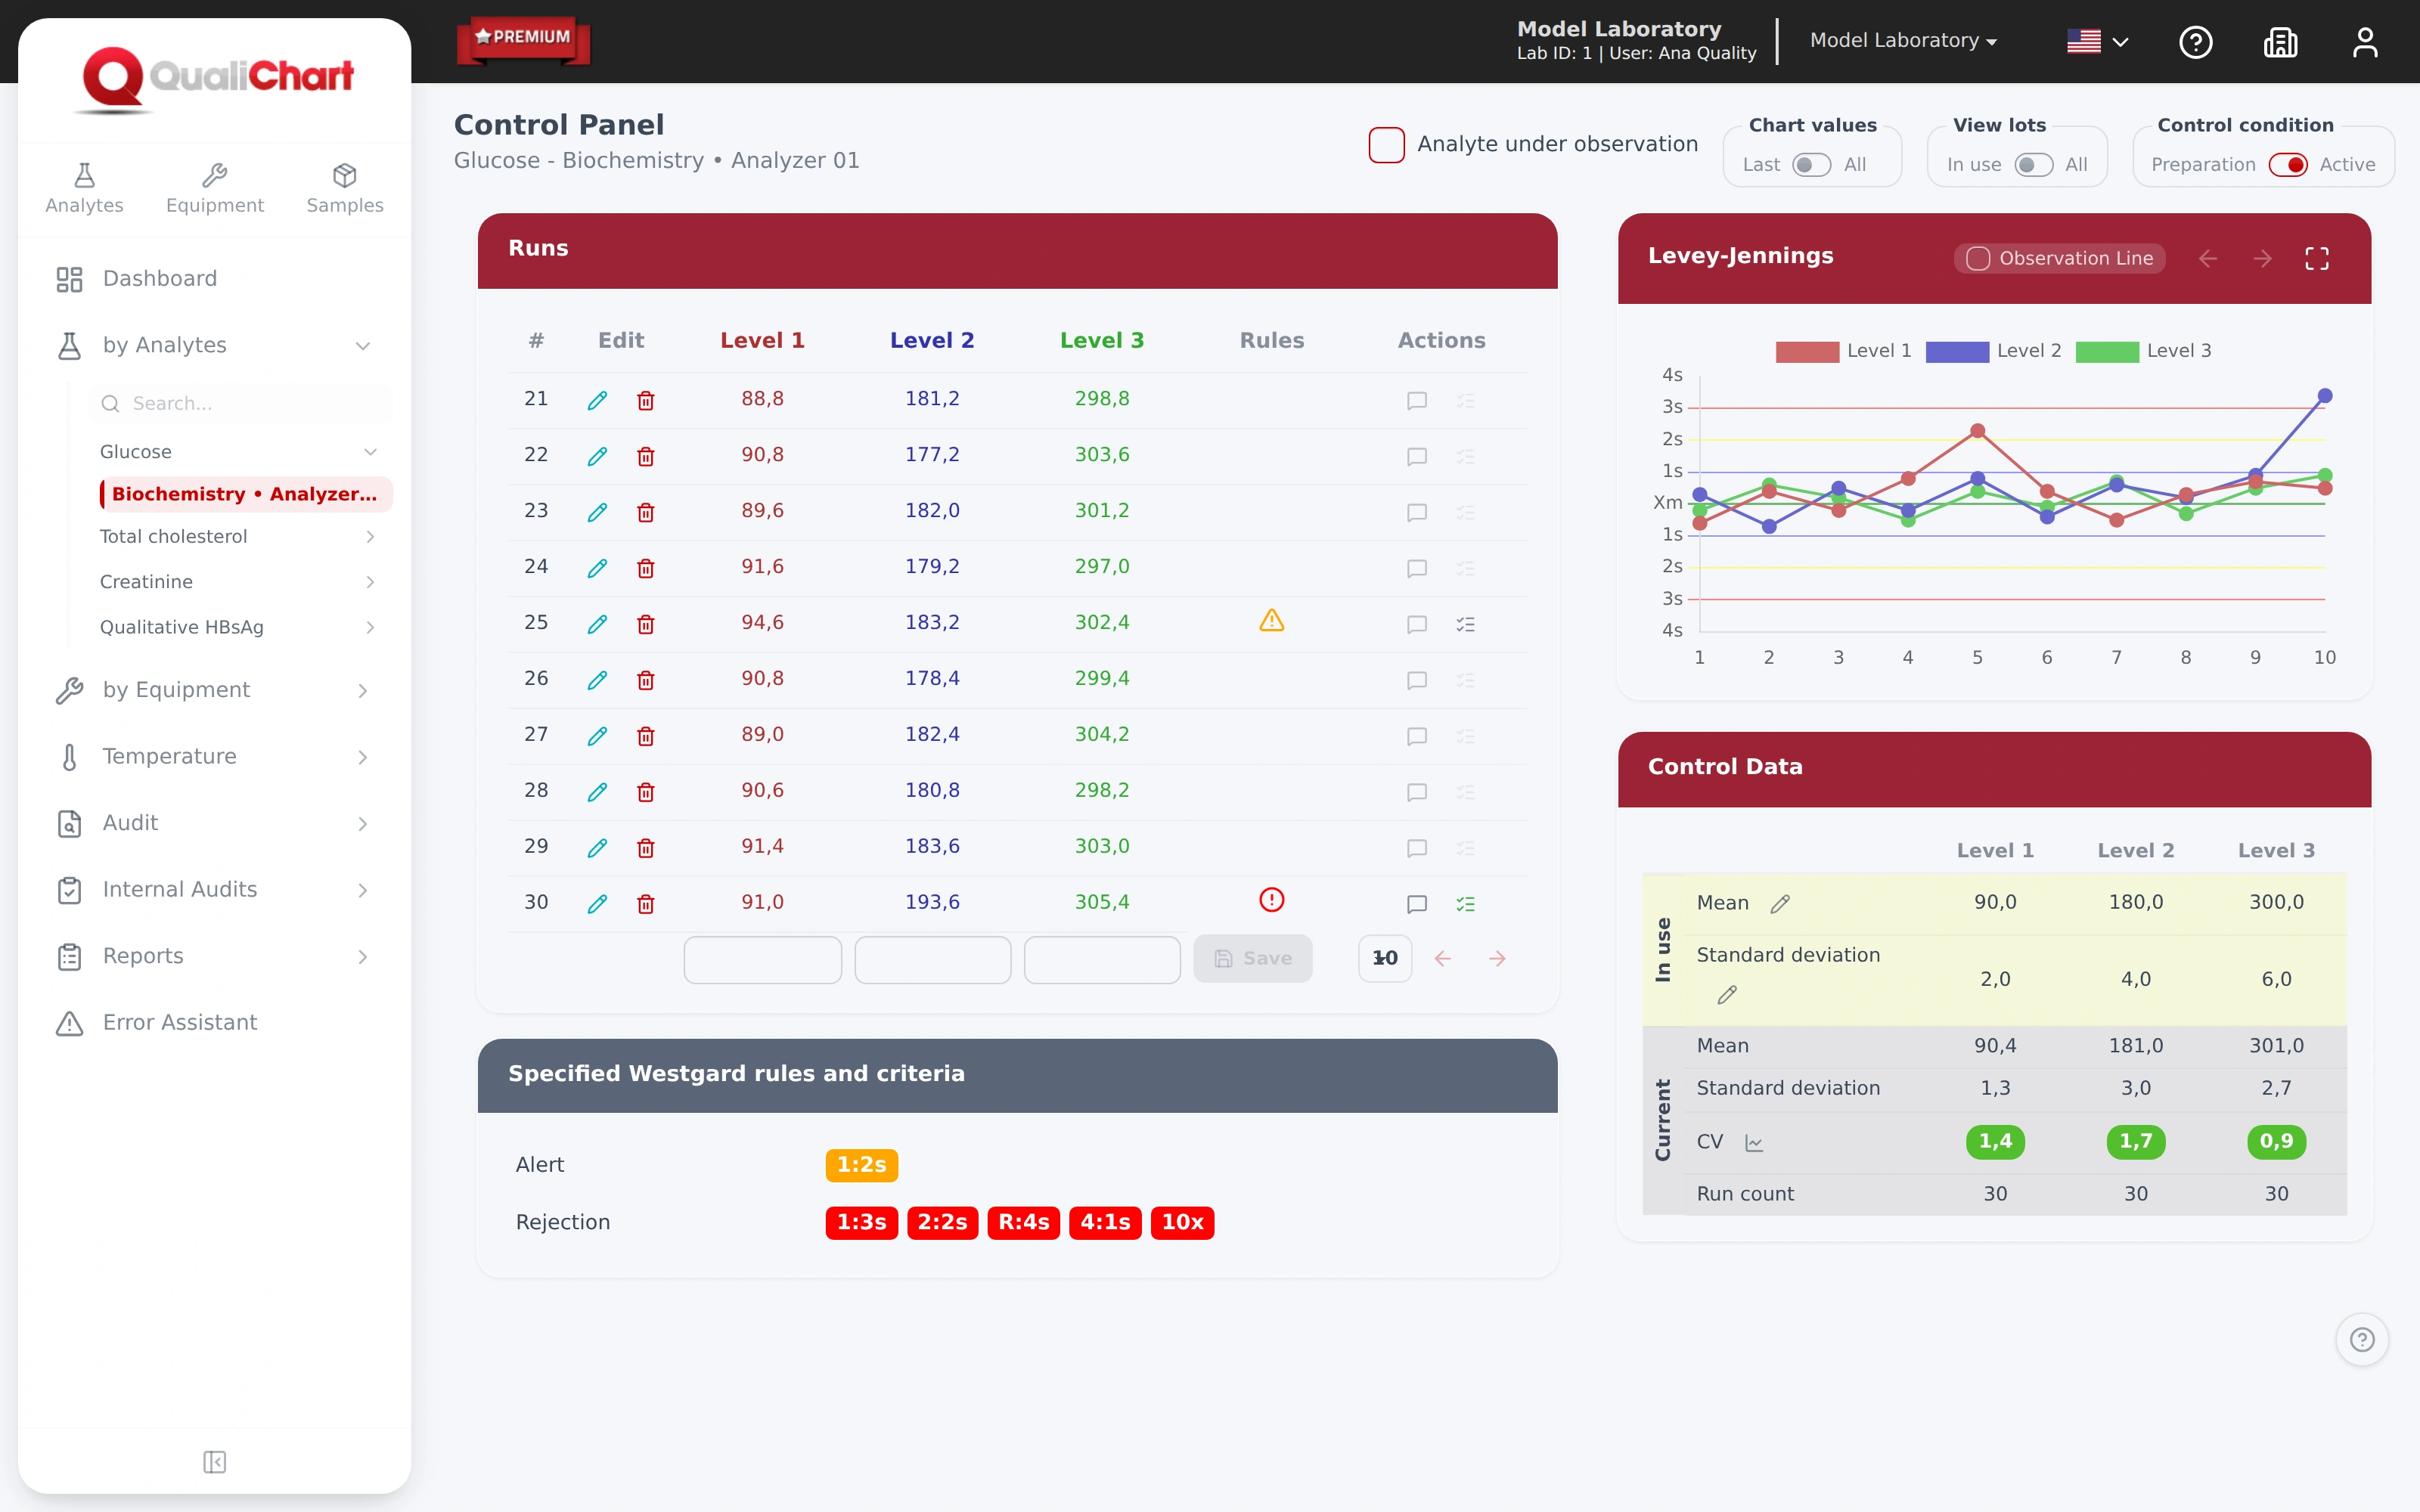
Compare three levels on the Levey-Jennings graph and see Westgard rule violations along with runs.
In this example: level 2 above +3 SD, with violation of the 1:3s rule.
Try for 30 days02 / Critical review
Investigate nonconformity, select causes and record corrective action in run context.
Rule, cause, action and date gathered to accompany the decision.
Try for 30 days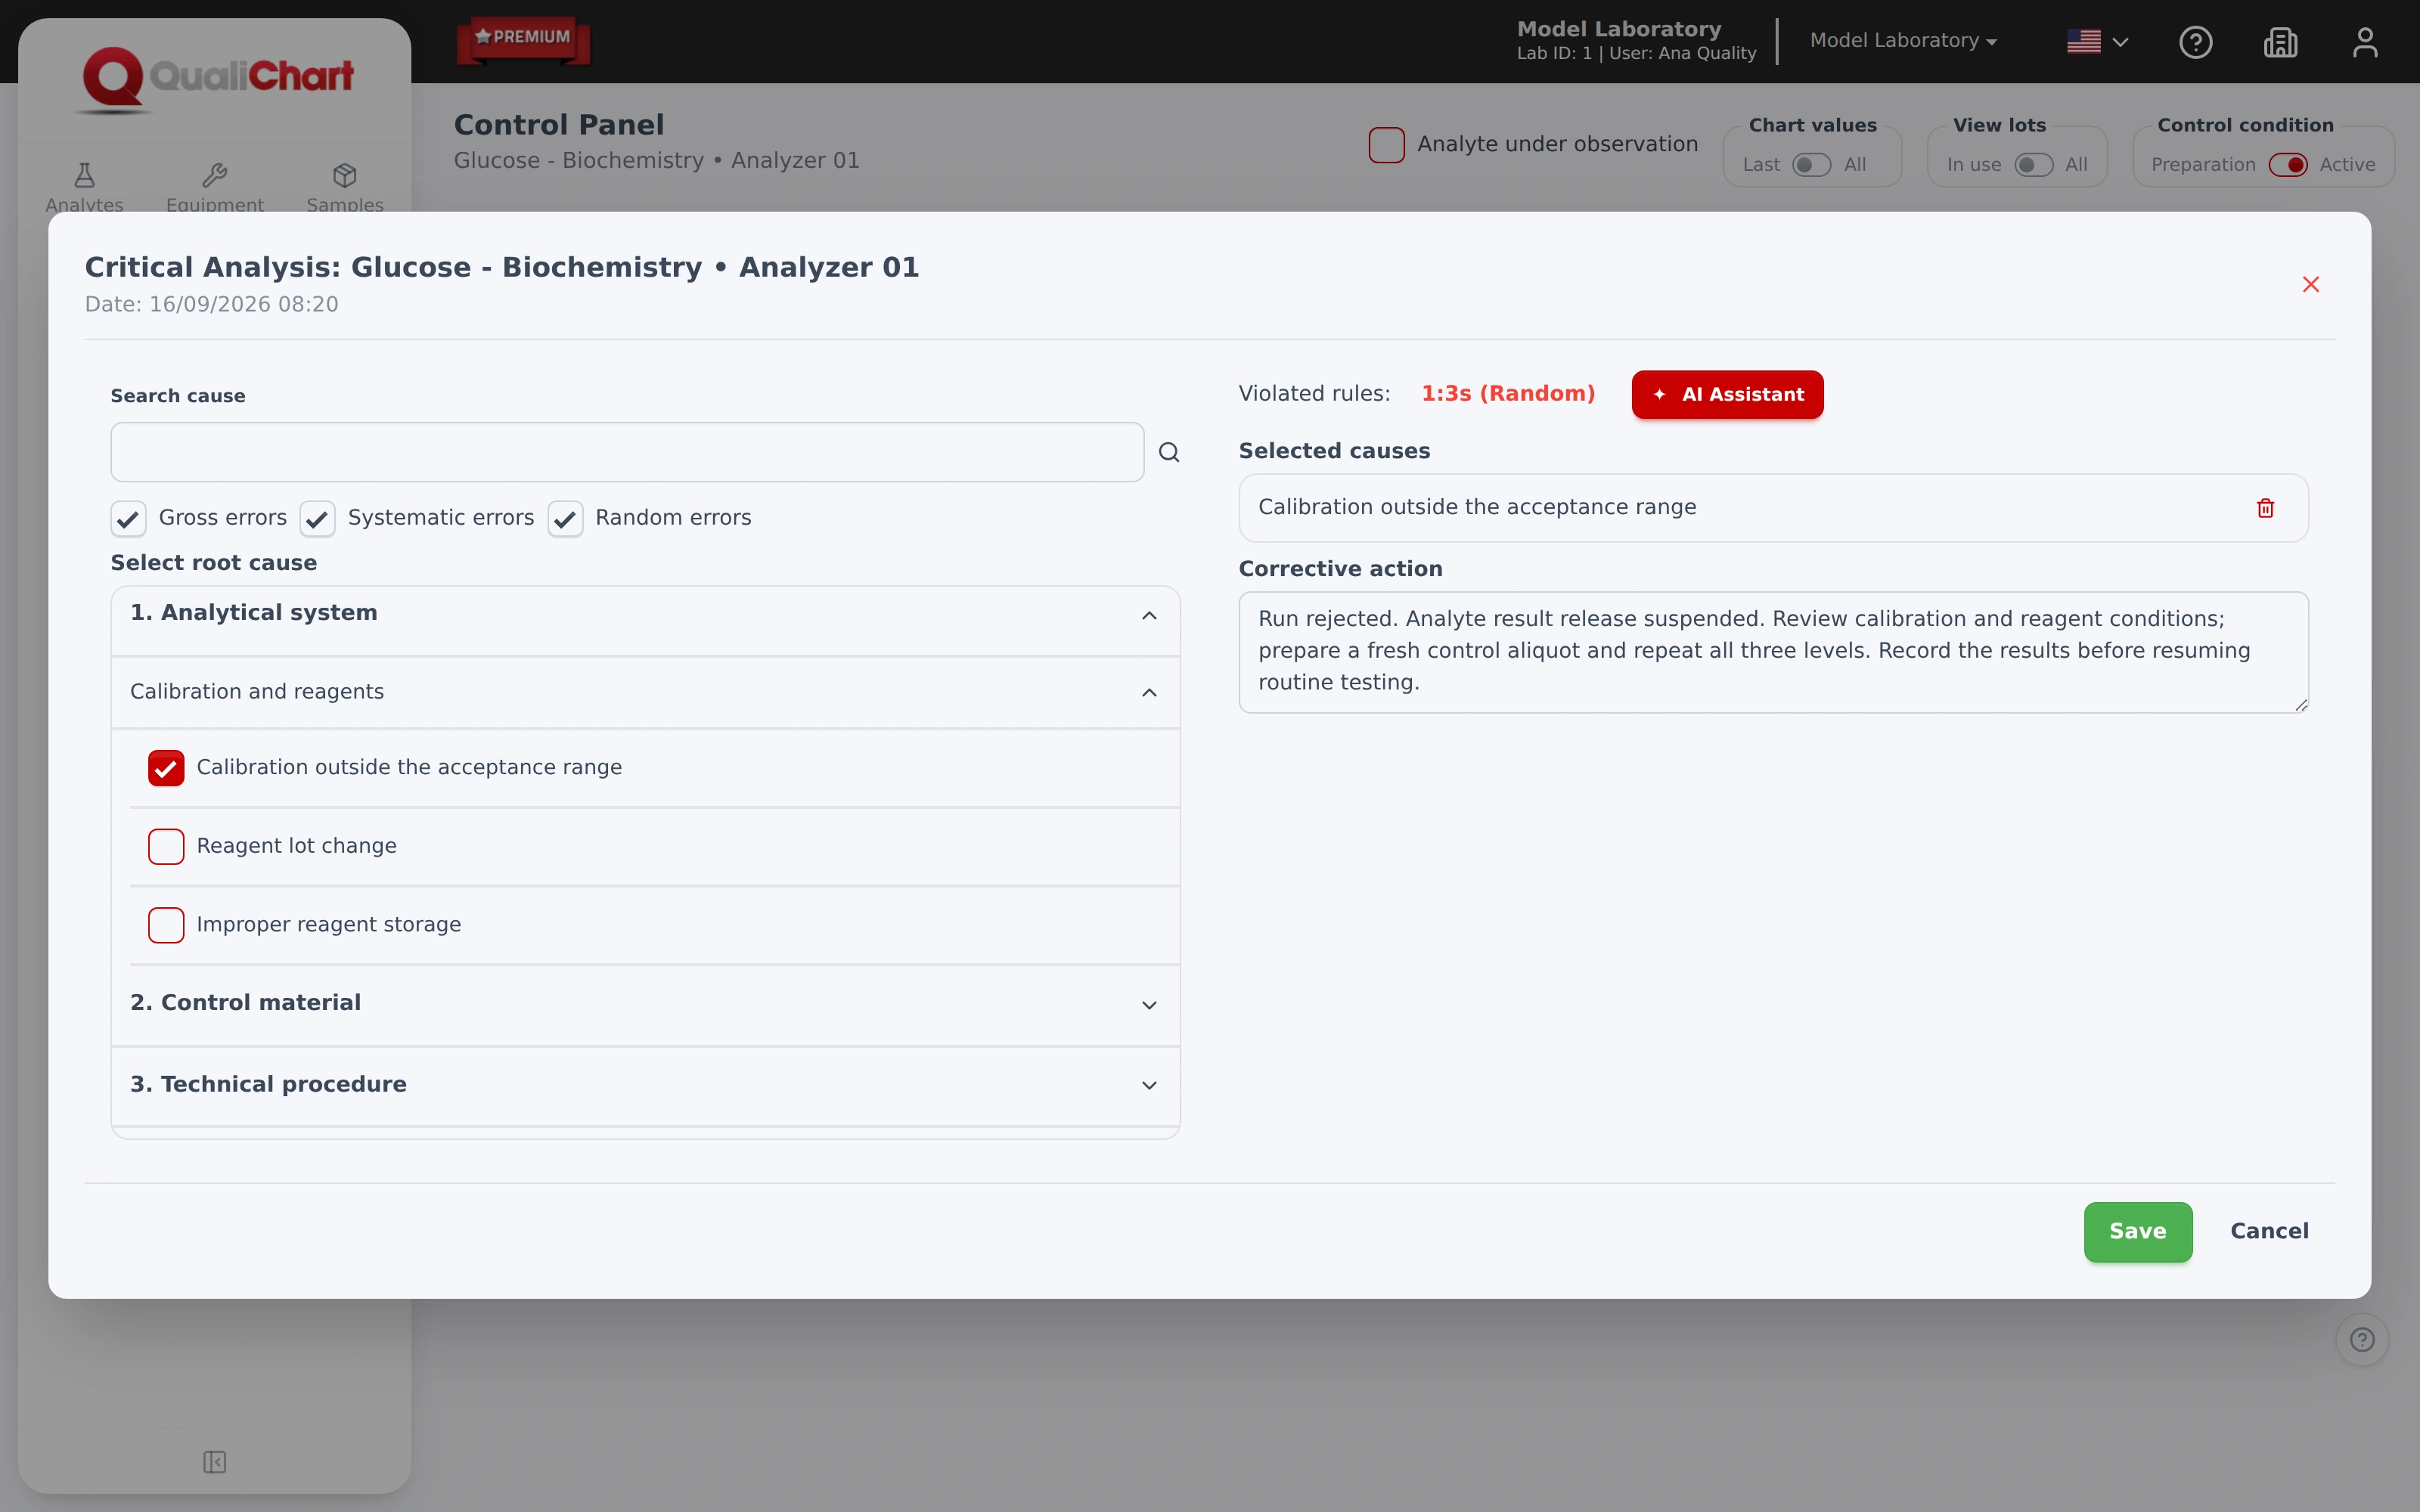
03 / AI Assistant
Consult suggestions for causes and next steps following a run with a broken rule, within the critical analysis itself.
AI supports research. The assessment and decision rest with your team.
Try for 30 days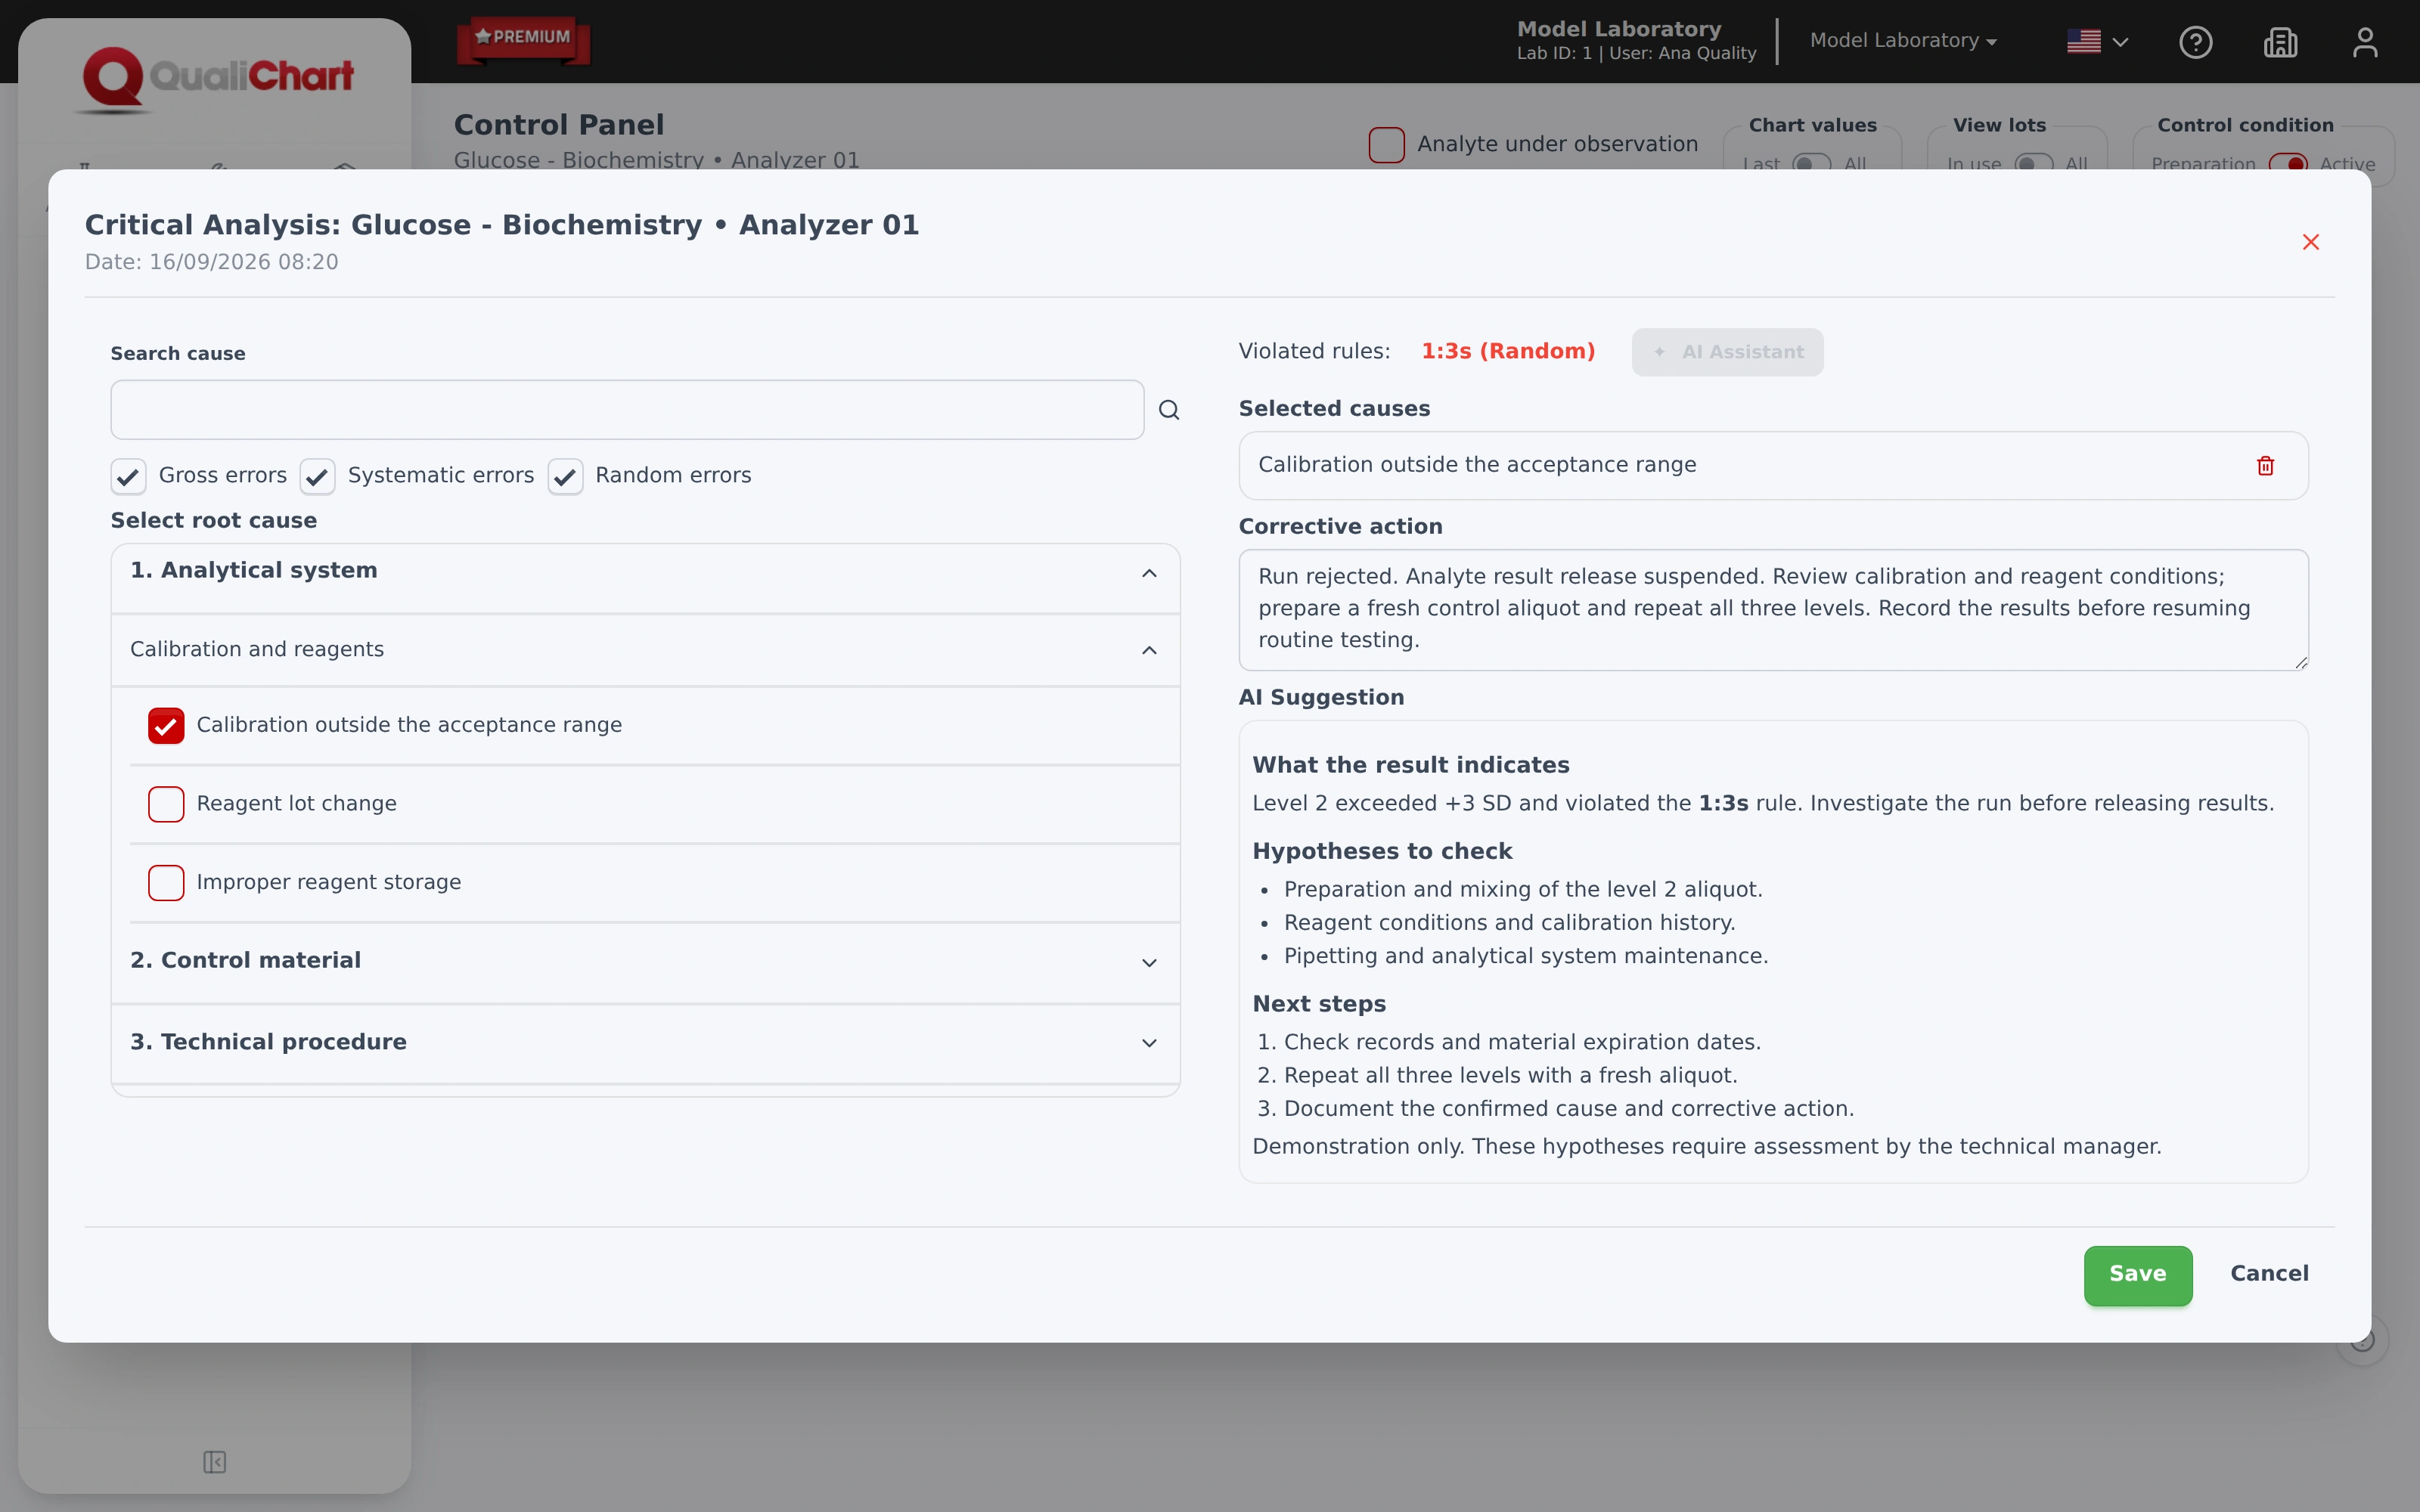
Beyond control runs
Analytical sigma, qualitative and semi-quantitative controls, critical supplies, temperature and audits: see what else your team can follow in QualiChart.
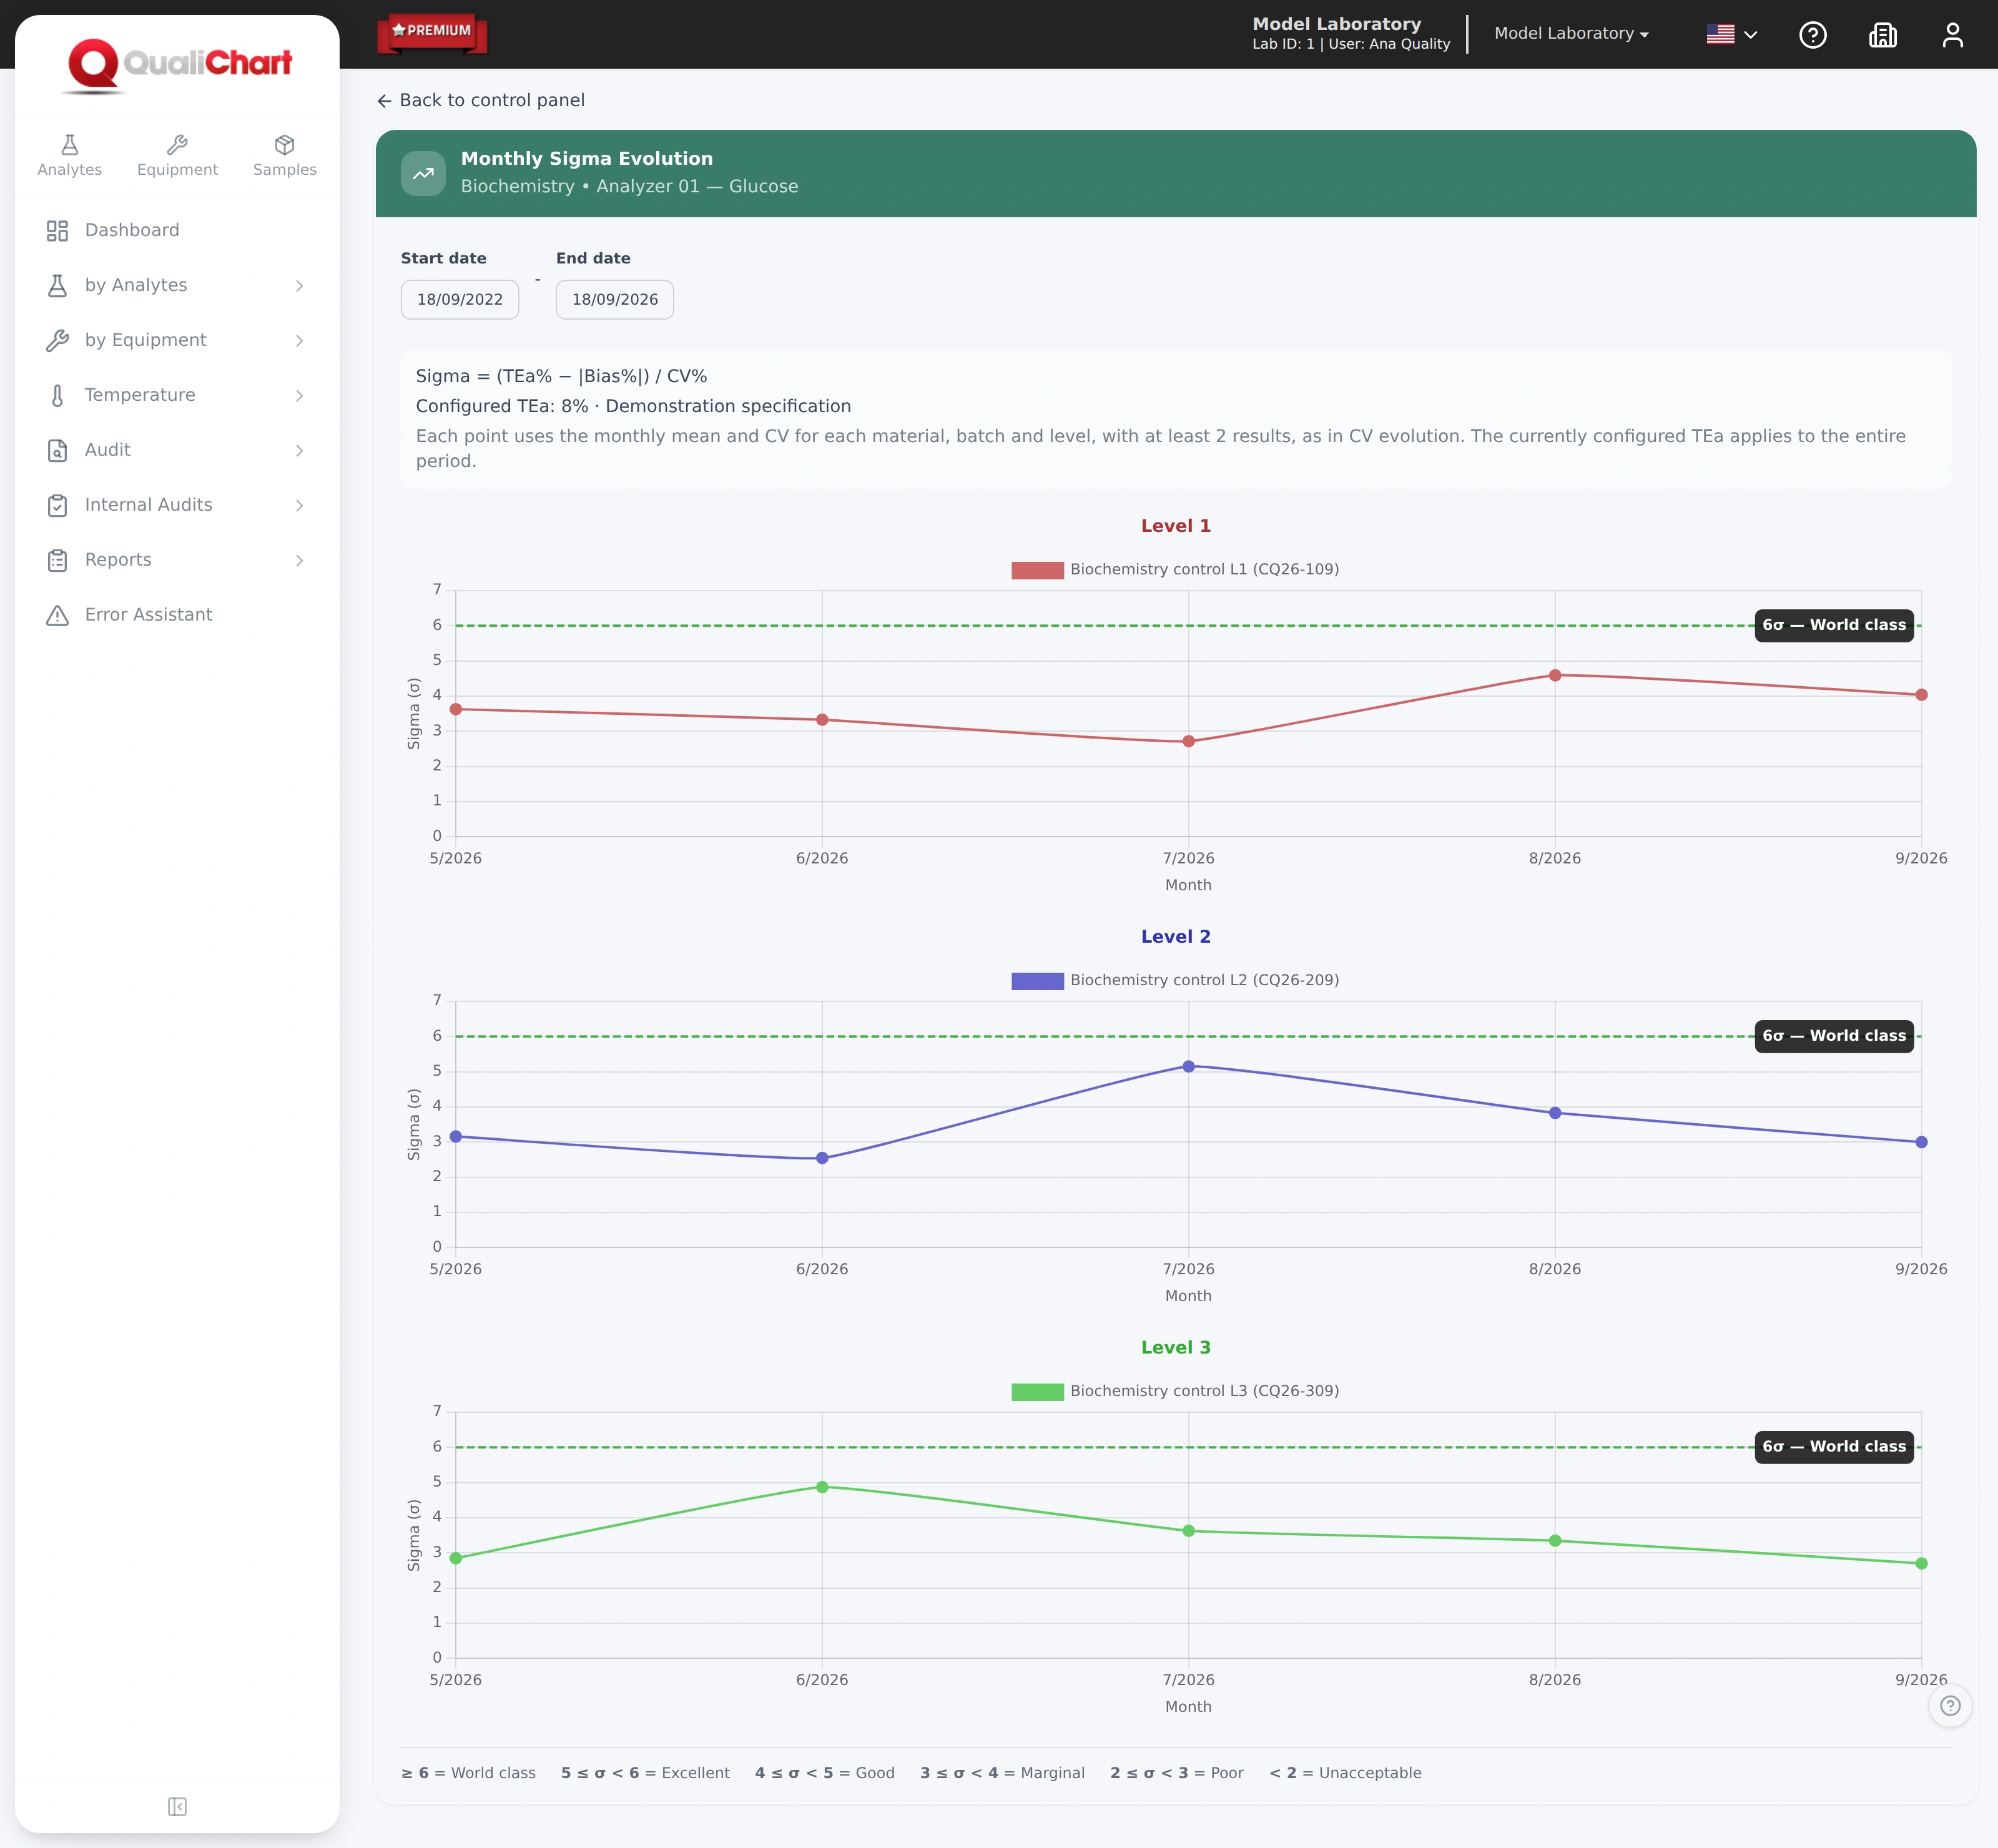
Analytical sigma
QualiChart calculates the sigma of each level using the TEa registered for the analyte, the bias against the package insert target and the cumulative CV: σ = (TEa% − |bias%|) / CV%.
Qualitative and semi-quantitative
Qualitative analytes are evaluated against the expected result. Semi-quantitative analytes, against an acceptable range on an ordered scale, such as Negative, Trace and 1+ to 4+.
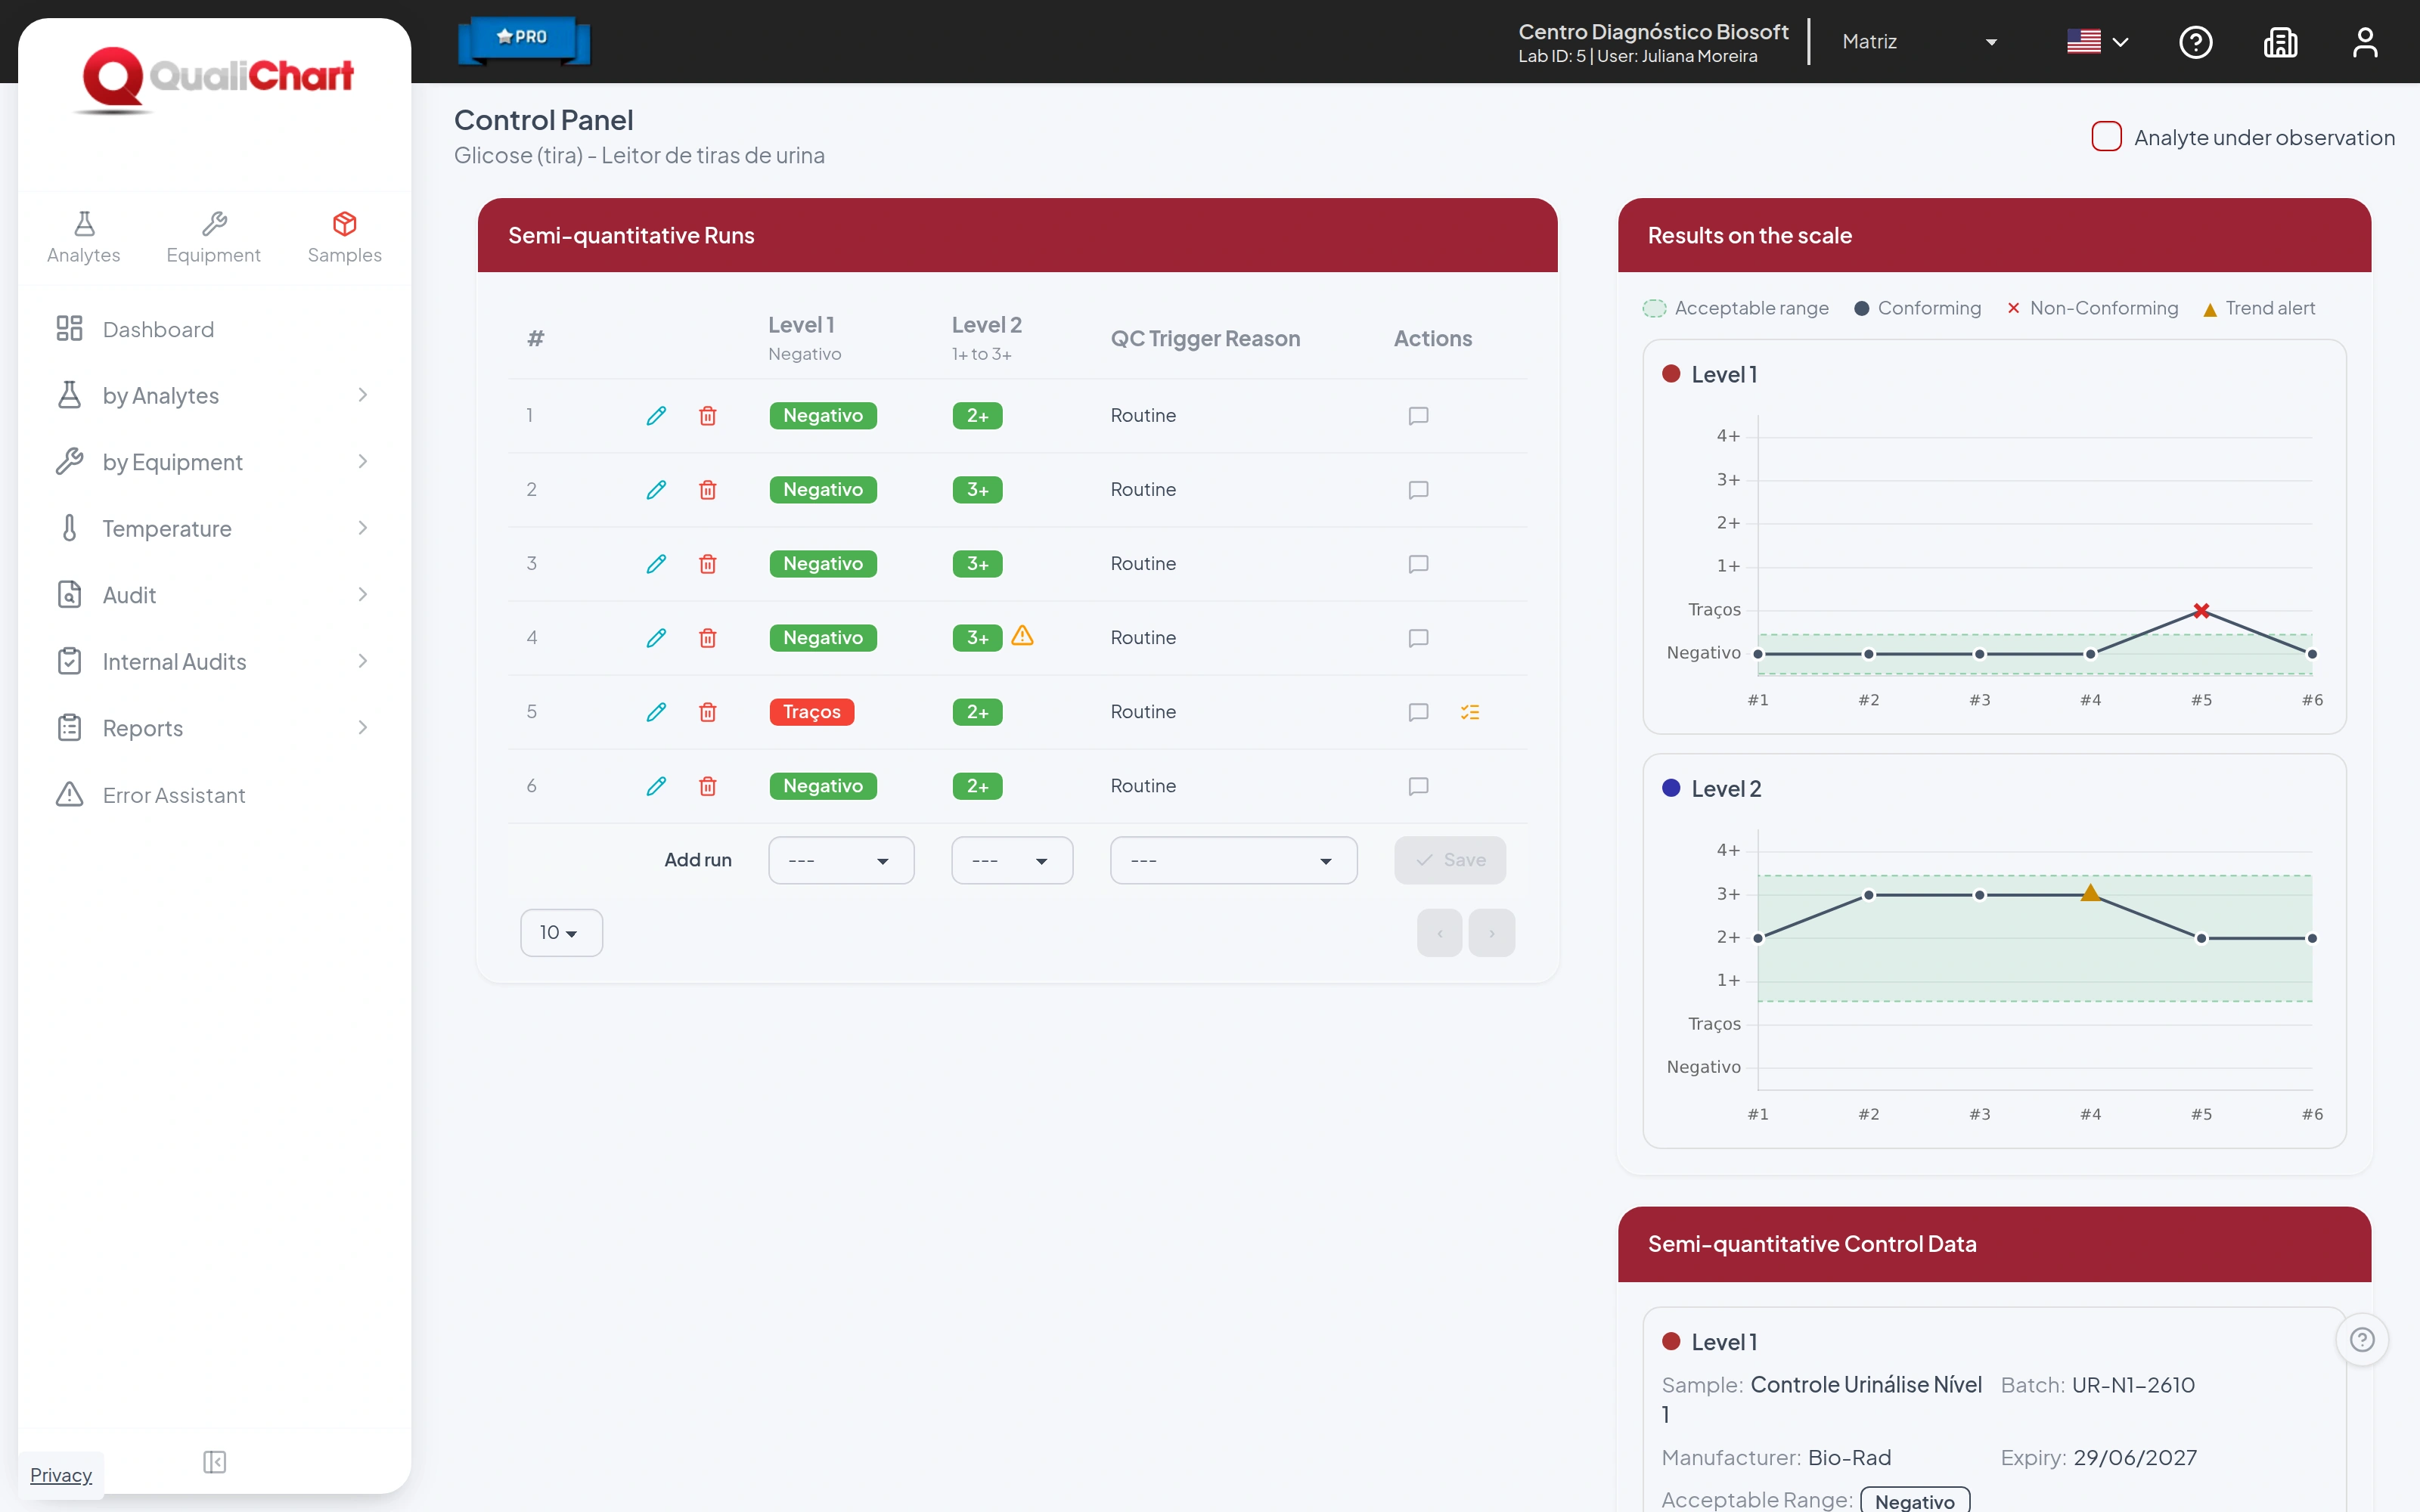
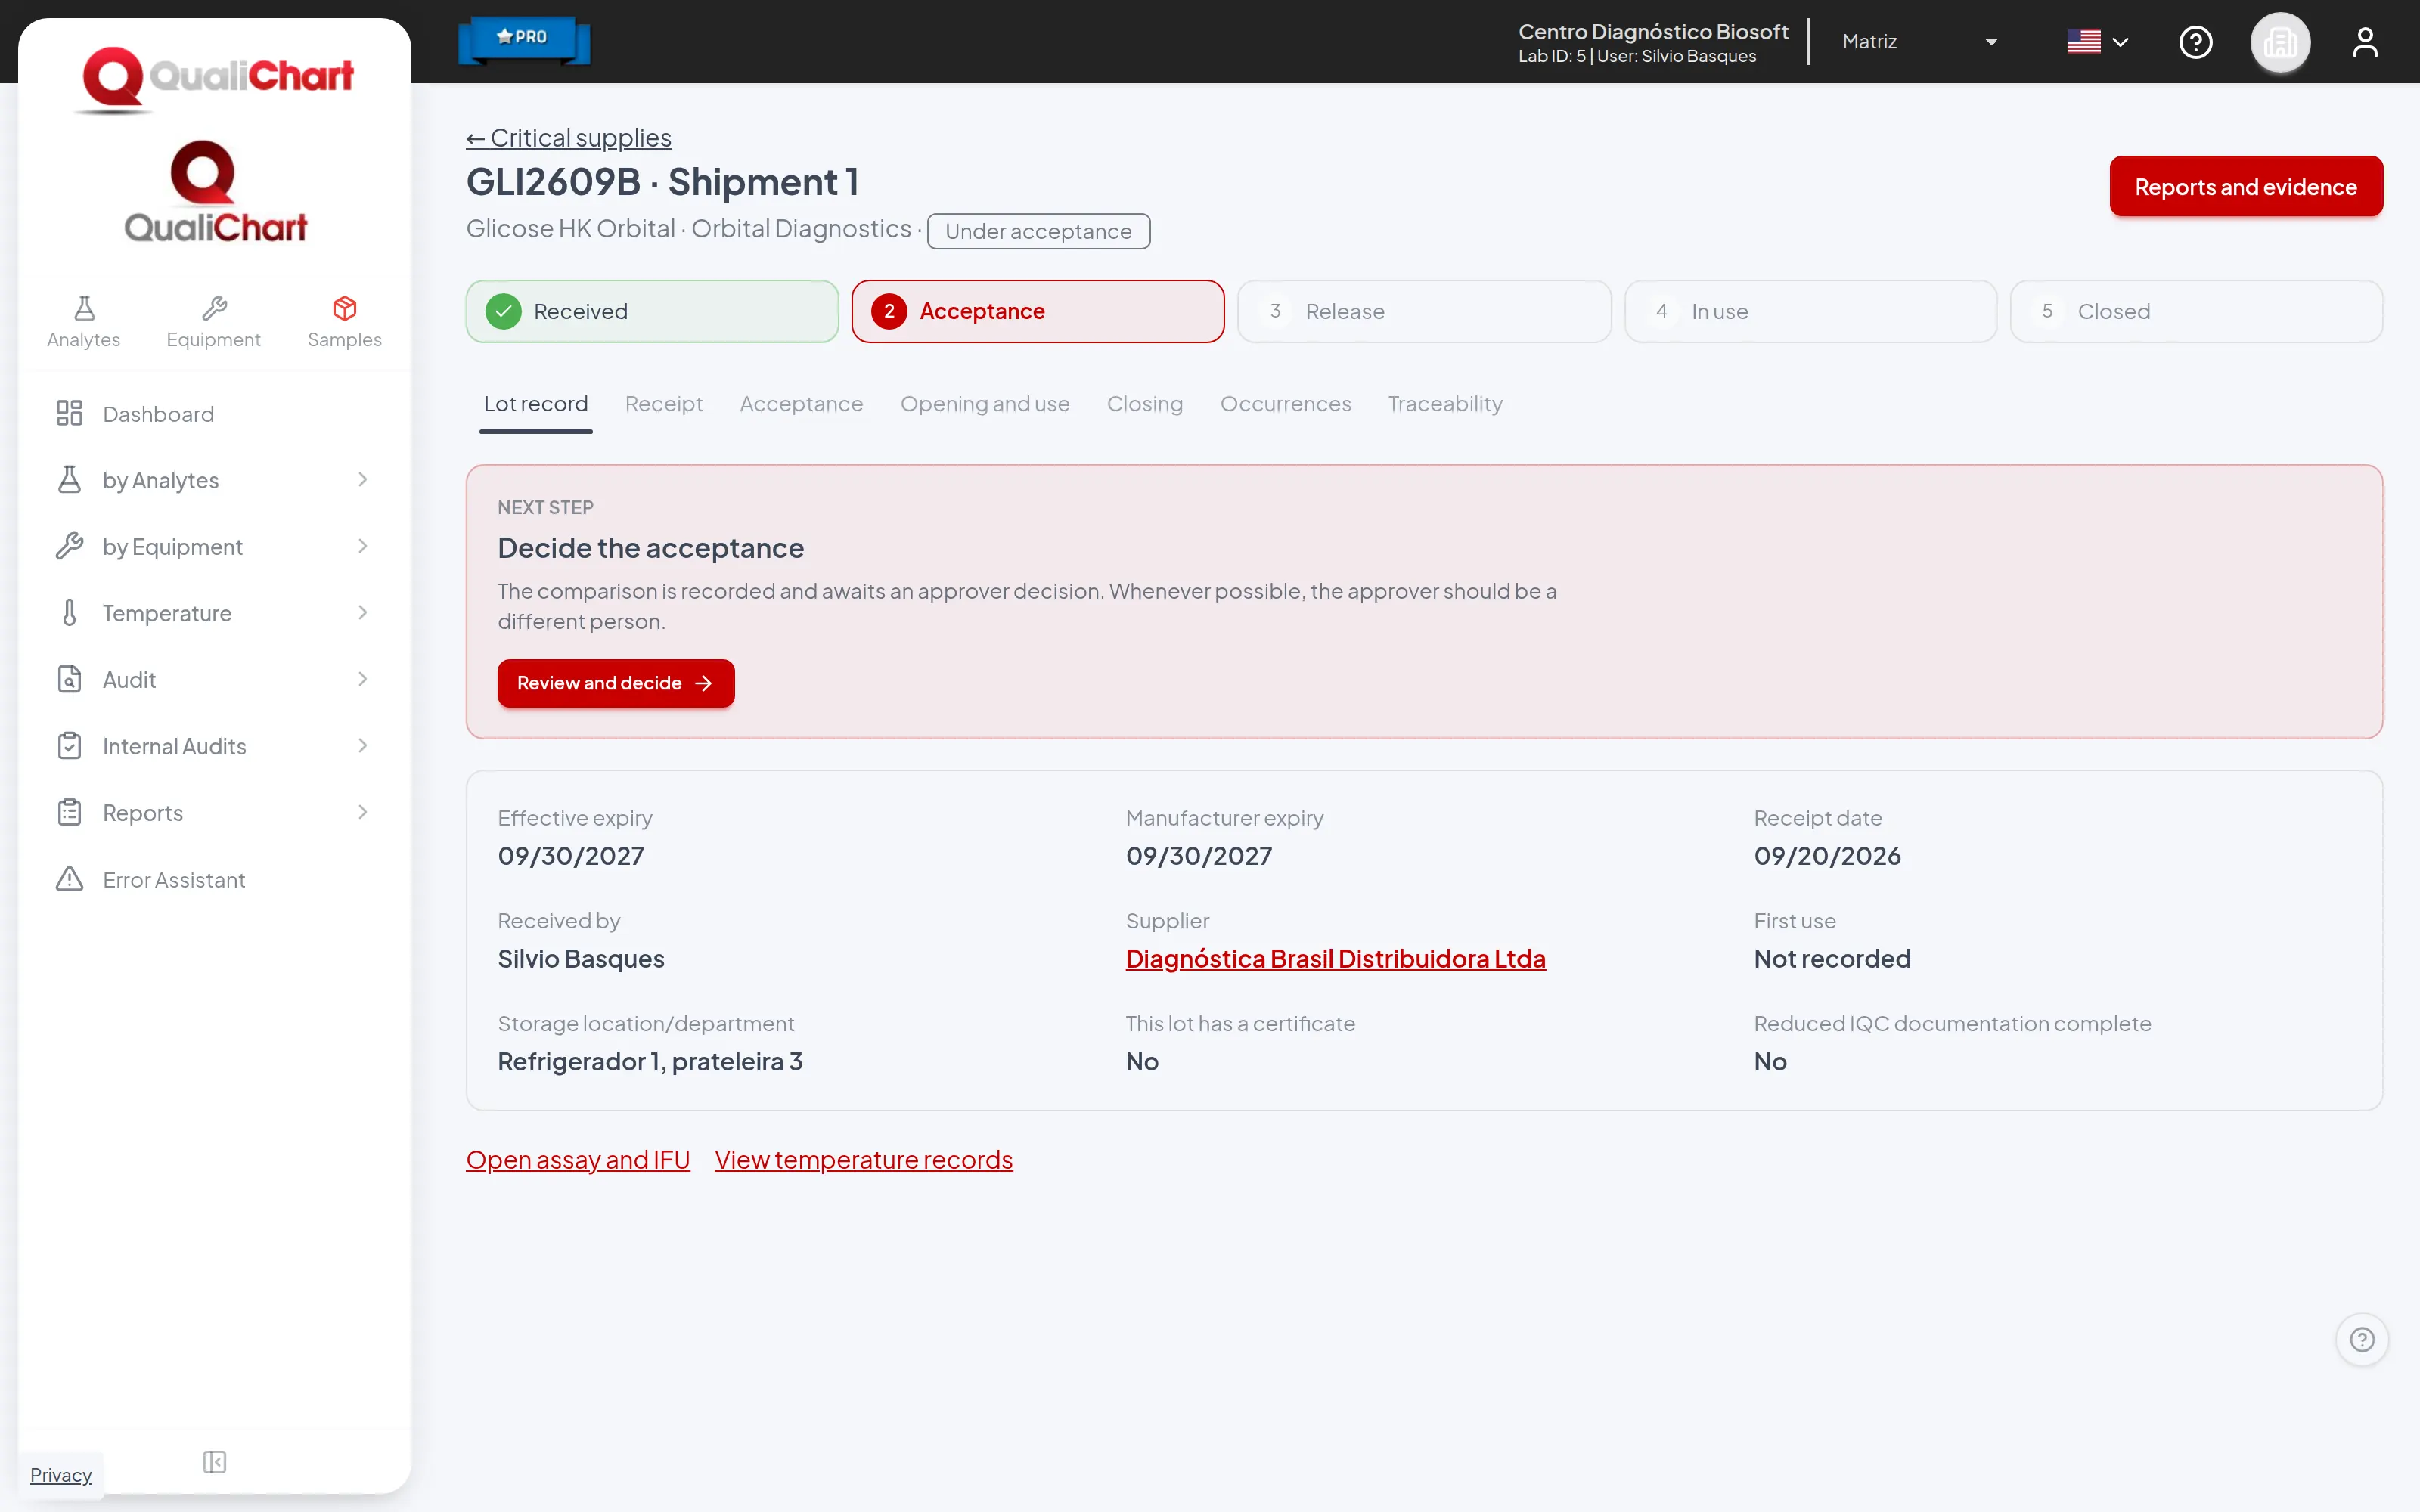
Critical supplies
Reagents, calibrators and critical consumables follow their life cycle in the system: approved supplier, receipt, acceptance, use on controls and closure, always with the next step indicated.
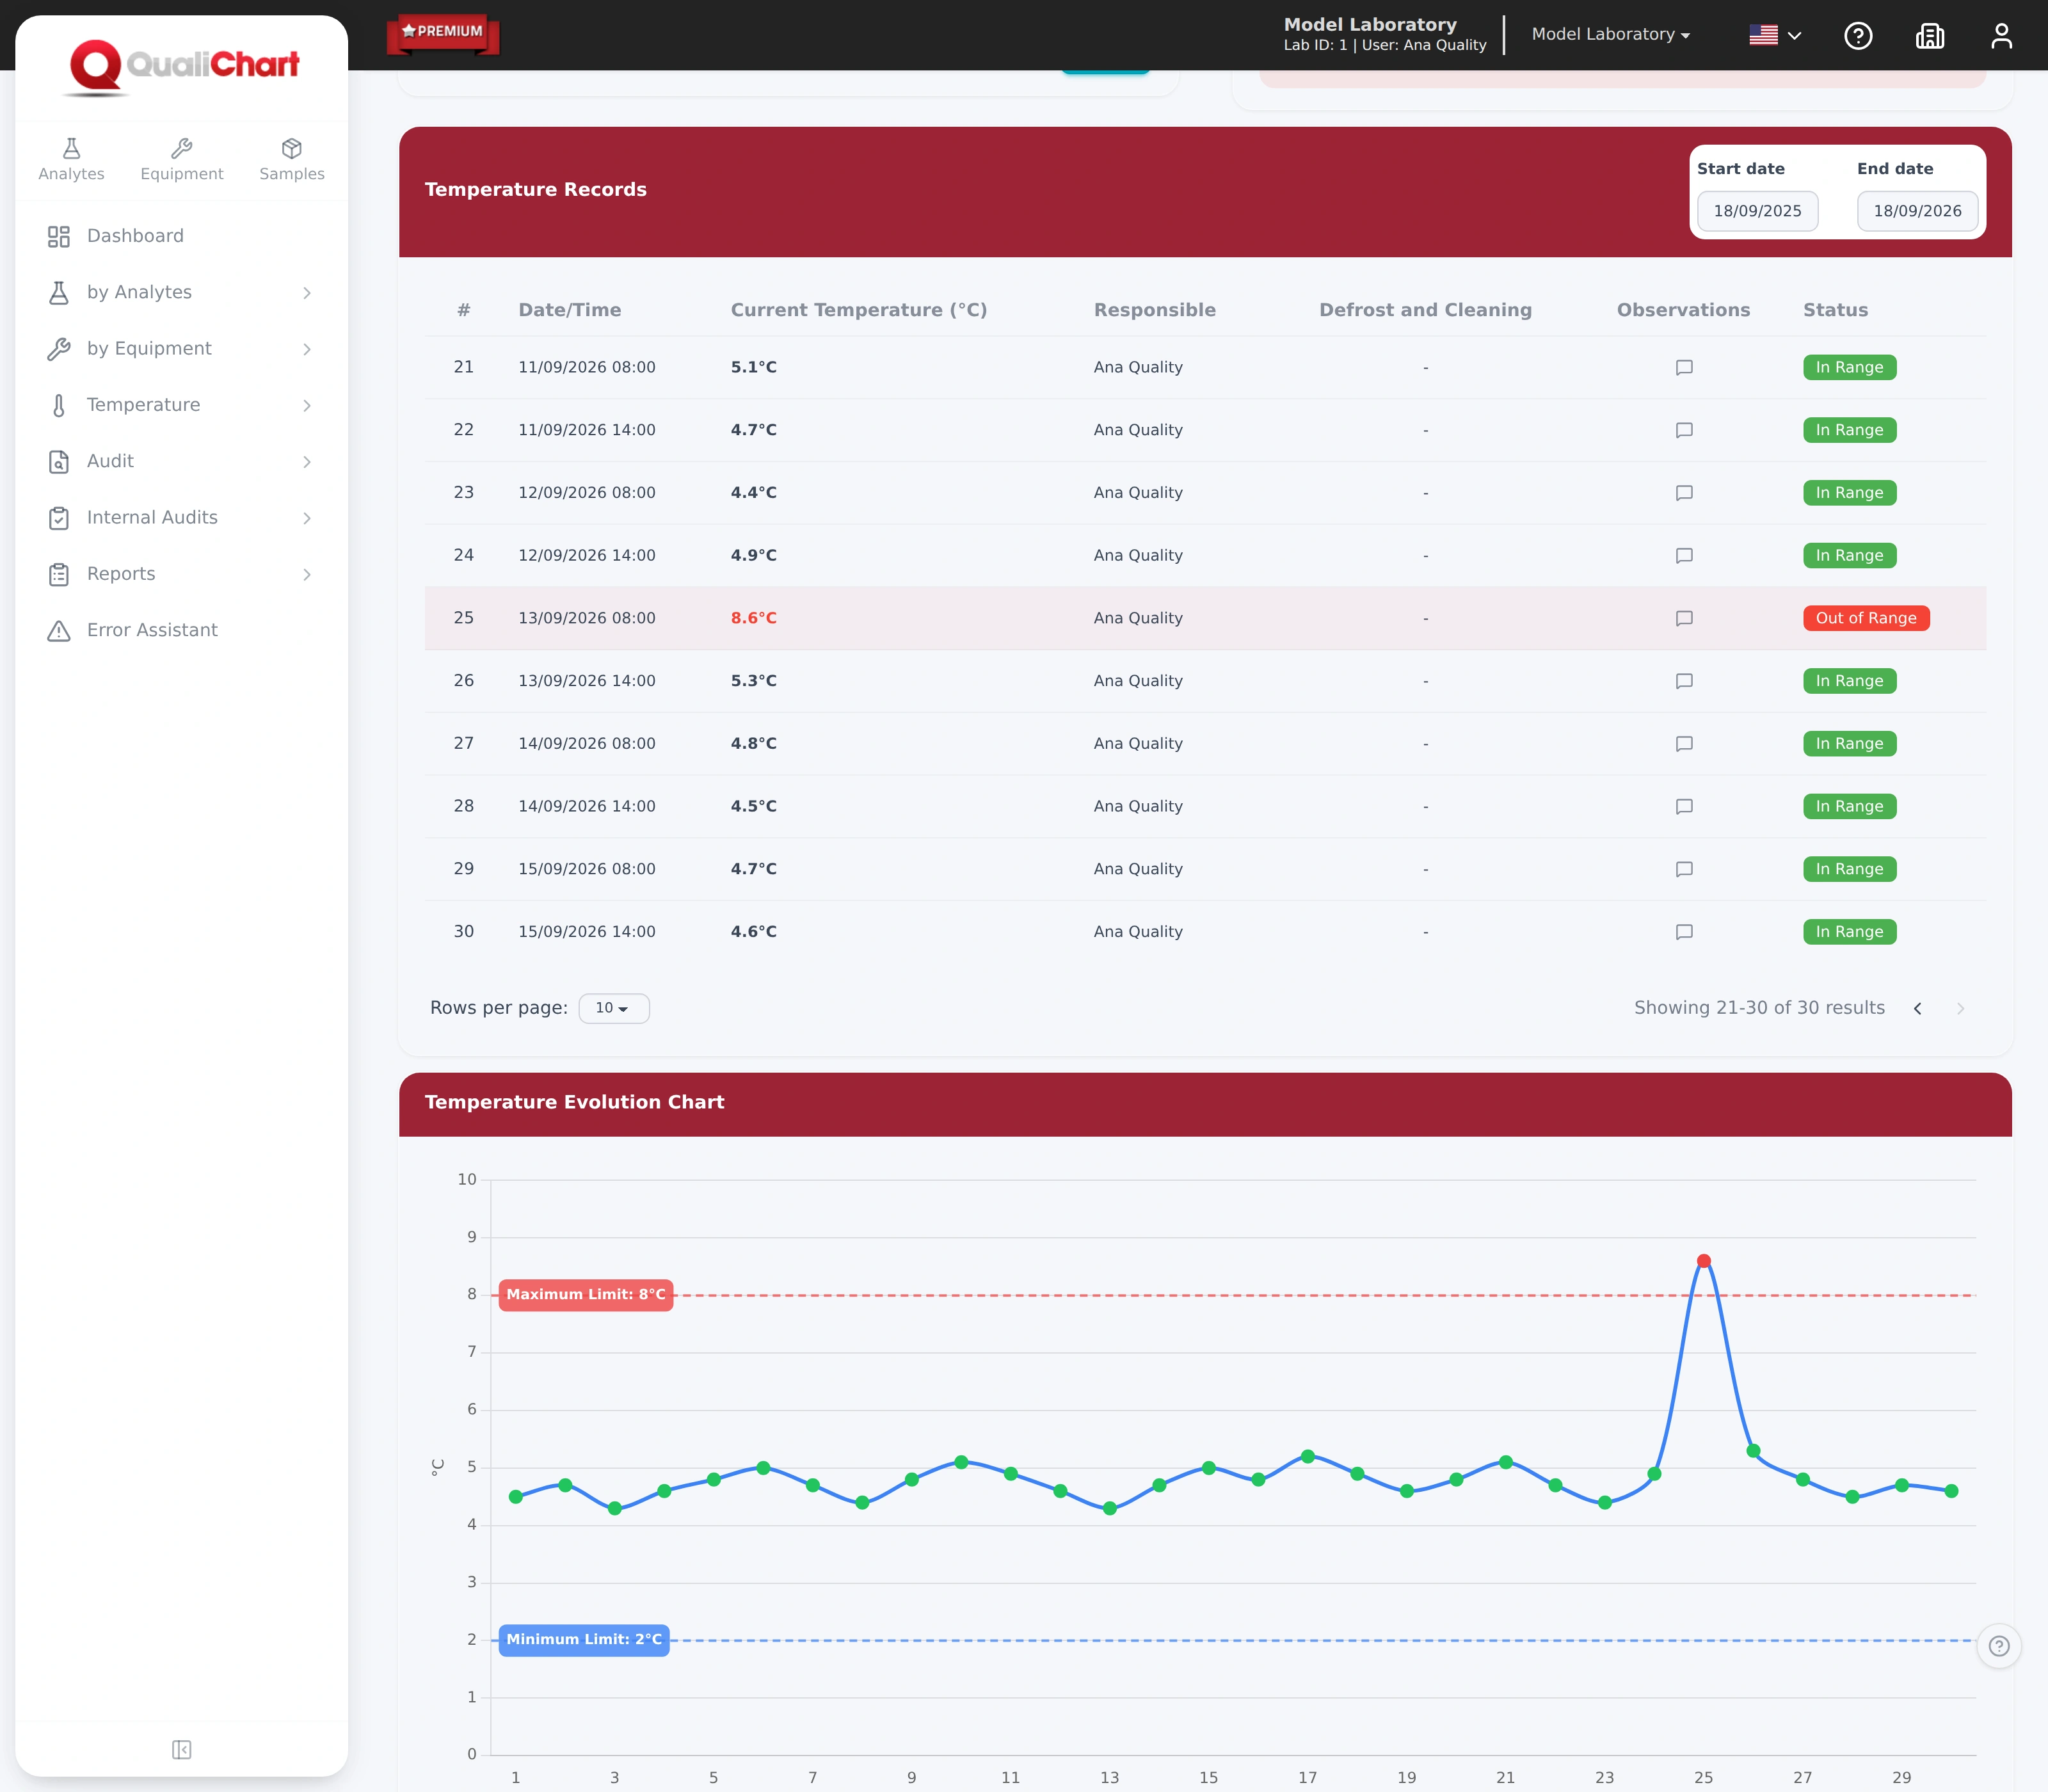
Equipment and temperature
Track refrigerators and other equipment with defined limits, measurement history and records of who took each reading.
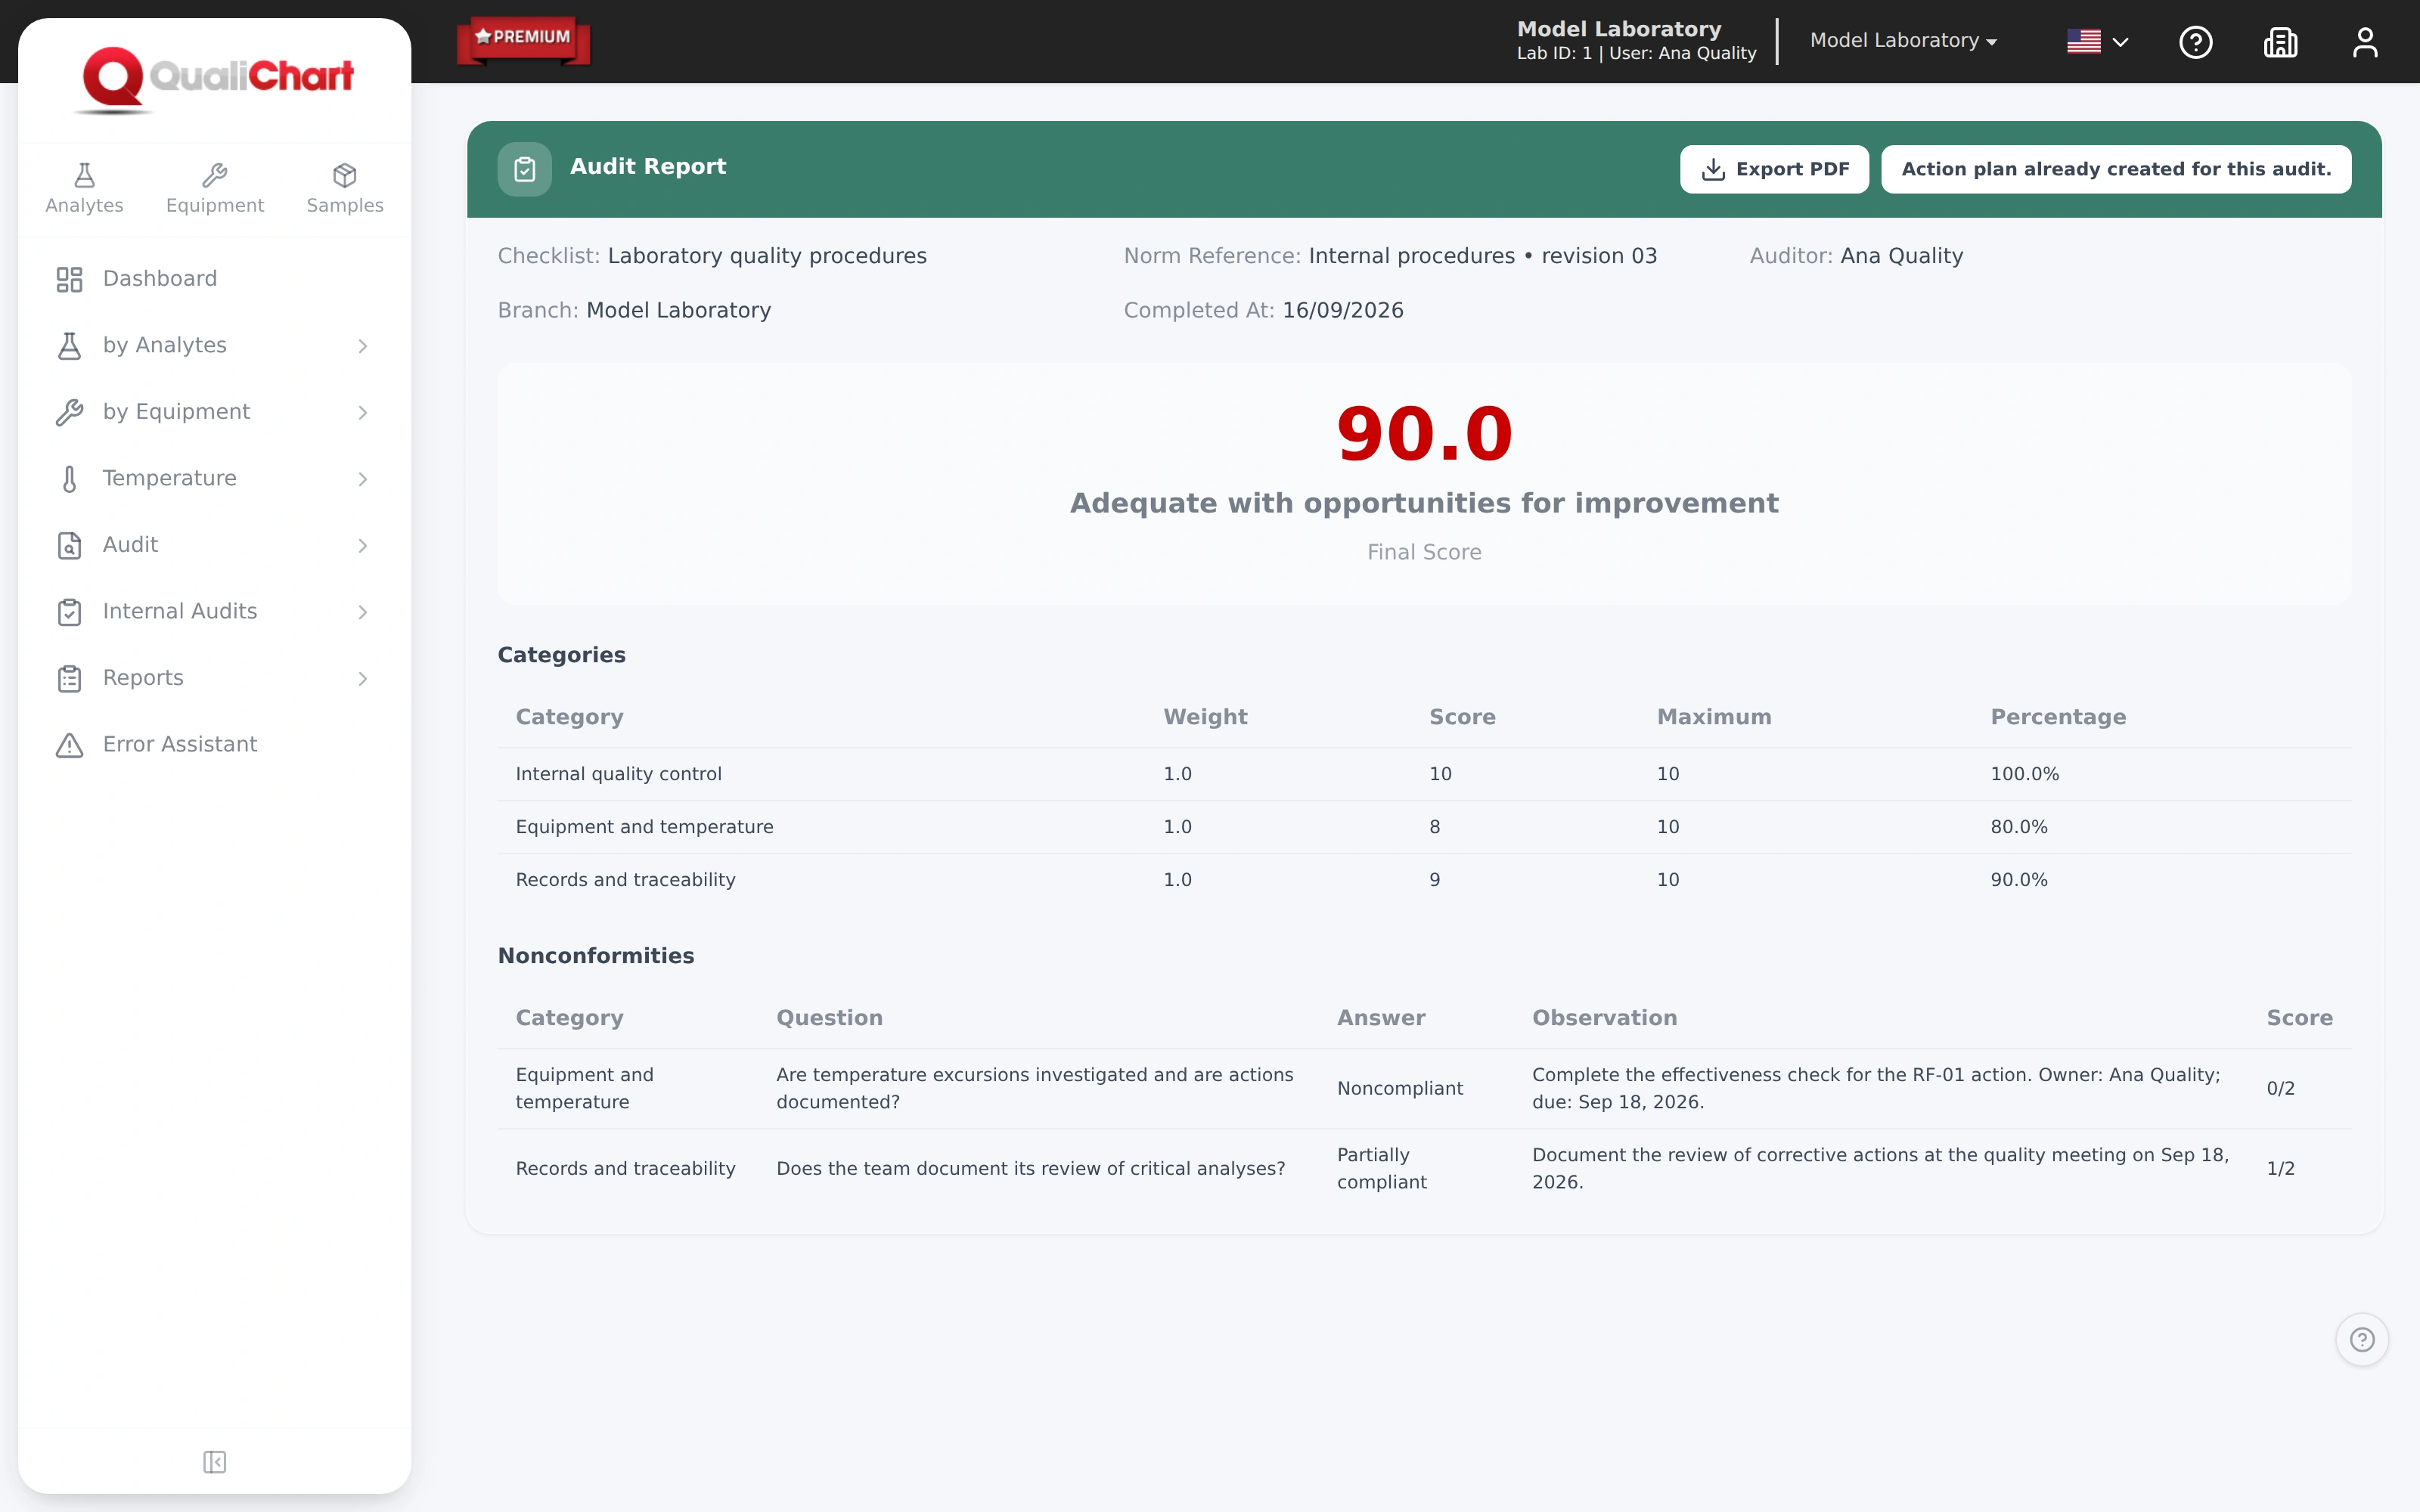
Internal audits
Evaluate the routine with checklists, gather evidence and track nonconformities in a report by category.
Register analytes, equipment and control materials. Register or import runs, view alerts and monitor the evolution of the coefficient of variation.
See this flow in a demoStructure equipment, materials, batches and levels used in routine.
Levey-Jennings, mean, standard deviation, CV and Westgard rules support the evaluation of runs.
Document the investigation, identified causes, and corrective actions for later reference.
Monitoring after implementation for your team to gain autonomy in the tool.
Premium DetailsScientific consultancy to support error investigation and performance interpretation.
PLUS DetailsIQC resources for teachers and educational institutions.
Edu DetailsResults, observations, and corrective actions help organize IQC documentary evidence. Consult the requirements of RDC 978/2025 and its changes with the technical responsible.
Evaluate the routine with the RDC 978 diagnosisDiscover the report from Laboratório Paulo C. Azevedo on the use of QualiChart.
Read Lab CaseThe price depends on the number of units and equipment, in addition to the plan and monitoring chosen. Therefore, prices are upon request. Request a proposal with the scope of your laboratory.
In the demonstration, we show the routine and data that you already use. The team combines the setup and training outlined in the plan. The schedule depends on this survey.
The system offers import of runs via CSV file. The team guides the format and evaluates the data available for the transition.
Compare with Spreadsheets DoesEnter the manufacturer, model and export format. Compatibility needs to be assessed for your environment prior to hiring.
Understand integrationAccess to the system is via user account and HTTPS connection. The Privacy Policy describes data processing and the channels for exercising your rights under the LGPD. Ask the team for the data storage, backup, access and processing conditions applicable to your contract.
Security and privacyYes. You can create an account and evaluate the system for 30 days free of charge. You can also request a guided demonstration. The commercial proposal informs users, equipment, validity, billing and cancellation rules before contracting.
Start my 30-day trialRecords for quality
RDC 978/2025 establishes requirements for services that perform clinical analysis tests. QualiChart helps organize control results, evaluation criteria and investigation records for review by the technician responsible.
Gather runs, graphs, average, standard deviation and CV by control, level and equipment.
Document the critical analysis, the hypotheses investigated and the actions in the face of results outside the criteria.
Consult the history to prepare technical discussion, audits and process evaluation.
The system supports documentation; compliance depends on the execution of laboratory processes. Diagnose your IQC routine.
Does your team use spreadsheets today?
Compare how investigation results, formulas, permissions, and records are maintained in a spreadsheet and a dedicated system.
Your next step in quality control
Create your account and evaluate QualiChart in your laboratory. Do you prefer a guided introduction? Request a demo with our team.