About the author

Thiago Lage
Thiago Lage has 15 years of experience in internal quality control (IQC) and more than 20 years in healthtech.
1. What analytical sigma means and when to use it
The analytical sigma metric combines total allowable error (TEa), bias and imprecision to assess a quantitative test against a quality goal. Six Sigma and 6 sigma are common terms in this context; the calculated value may be below or above six. [1]
Use it to support method evaluation, plan internal quality control (IQC), compare instruments under equivalent criteria and monitor improvements. Start with one analyte, instrument and concentration level. A single score for the whole laboratory can hide the level that needs the most attention. [2]
2. TEa: choose the goal before looking at the result
TEa is the allowable total error specification for the intended use of a test. It is neither the error measured in your routine work nor maximum imprecision. A CV goal limits dispersion; TEa sets an allowance that considers analytical performance more broadly. [1][3]
The Milan consensus describes specification models based on clinical outcomes, biological variation and the state of the art. Suitability depends on the measurand and application. In the EFLM database, check the matrix, evidence quality and specification level; do not copy within-subject CV or an imprecision limit into a TEa value. [3][4]
CLIA publishes acceptance criteria for proficiency testing in the United States. These can support a documented goal, but do not automatically become a Brazilian requirement or demonstrate suitability for every clinical decision. Record the source, version, unit and rationale. Changing the goal to raise sigma does not improve the method. [5]
3. Bias: what is the comparison value?
Bias estimates the systematic difference between the observed mean and a reference or target value. A traceable reference with suitable material differs from a peer-group mean. Peer consensus allows comparison of similar systems but may share a deviation from a higher-order reference. [2]
The package-insert target of an assayed control may provide a practical estimate when a better reference is unavailable. Use the value for the correct lot, method and unit. Consider matrix effects, commutability and assigned-value uncertainty: this result does not independently demonstrate trueness in patient samples. [2]
Bias (%) = 100 × (observed mean − target) ÷ target
Keep the sign when investigating the direction of the deviation; use its absolute value in sigma. Comparing the observed mean with itself produces zero bias by construction. The local mean used to center a control chart does not thereby become an independent accuracy reference. [6]
4. CV: use data that represent routine performance
CV (%) = 100 × standard deviation ÷ observed mean
Estimate imprecision using results from the same level and measuring system under defined conditions. Within-run replicates describe repeatability; data from different days and routine conditions may reflect greater variability. State the design used. Do not substitute the maximum desirable CV for observed CV. [1]
Document the period, observation count, lot, instrument and inclusion criteria. Small samples leave estimates unstable: being able to calculate SD from two results does not make sigma robust enough to redesign IQC. Define sampling in the evaluation protocol and examine the control chart before summarizing the series.
Do not exclude results solely to improve the indicator or replace every failure with a passing repeat. Investigate assignable causes, preserve traceability and apply a documented policy for exclusions and repeats. Pooling periods before and after a major change can hide both failure and recovery.
5. How to calculate sigma: a worked example
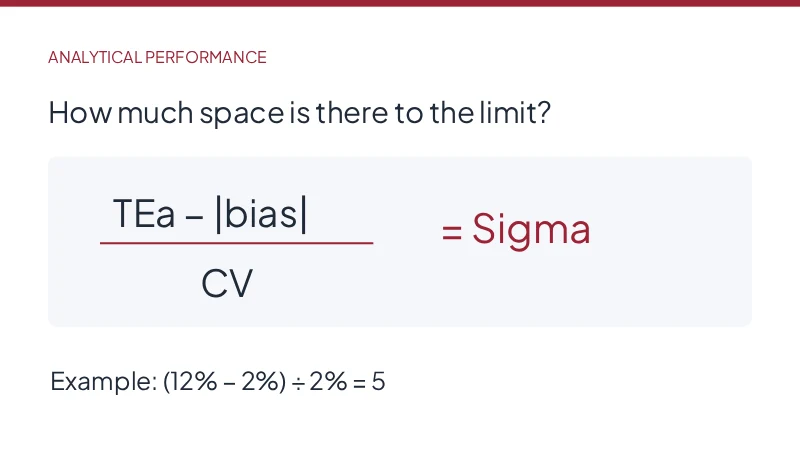
Sigma (σ) = (TEa% − |bias%|) ÷ CV%
Consider a teaching example: target 100 mg/dL, observed mean 101 mg/dL, SD 2.02 mg/dL and TEa 10%. Bias is +1%; CV is 2%; sigma = (10 − 1) ÷ 2 = 4.5. This goal is hypothetical, not a recommendation for an analyte.
With other terms unchanged, increasing bias to 3% reduces sigma to 3.5; increasing CV to 3% reduces sigma to 3. Investigation must distinguish a mean shift from increased dispersion. The number alone does not identify the cause.
State the denominator convention. Usual CV is relative to the observed mean, whereas percentage bias is commonly relative to the target. Do not assume exact equivalence with (absolute allowance − |absolute difference|) ÷ SD when the bases differ. For rigorous comparisons, keep a documented convention consistent across studies. [6]
6. Percentage, absolute and mixed TEa: a CLIA example
In the CLIA routine chemistry table, glucose has an allowance of ±8% or ±6 mg/dL, whichever is greater. To apply this specification, convert the limits to the same unit using the target value. Do not directly compare the numbers 8 and 6, add them or choose the smaller one. [5]
| Target (mg/dL) | 8% | 6 mg/dL | Effective TEa (%) |
|---|---|---|---|
| 50 | 4 mg/dL | 6 mg/dL | 12% |
| 75 | 6 mg/dL | 6 mg/dL | 8% |
| 100 | 8 mg/dL | 6 mg/dL | 8% |
| 250 | 20 mg/dL | 6 mg/dL | 8% |
For an absolute-only limit, TEa% = 100 × absolute limit ÷ target. With both, use the larger of this percentage and the specified percentage. Below 75 mg/dL in the example, the absolute limit governs; above it, the percentage governs. The rule comes from the chosen specification, not a decision to favor the result.
Each level uses its own target. Converting mg/dL to mmol/L also requires conversion of the absolute limit. Do not use the observed mean to move the acceptance boundary: that would let a method shift change the goal itself. Other specifications may use different rules; record the complete condition.
7. How to interpret a sigma value
The ranges below are conventional communication labels, not legal categories or automatic authorization to reduce controls. Read the value alongside the chosen TEa, the quality of the bias estimate, the period and each level assessed. [1][7]
| Sigma | Usual interpretation |
|---|---|
| σ ≥ 6 | World class |
| 5 ≤ σ < 6 | Excellent |
| 4 ≤ σ < 5 | Good |
| 3 ≤ σ < 4 | Marginal |
| 2 ≤ σ < 3 | Poor |
| σ < 2 | Unacceptable in the conventional classification |
A negative sigma means the magnitude of bias exceeds TEa, provided CV and inputs are valid. Retain that result and investigate. Zero CV, an unsuitable target or insufficient data do not justify claiming infinite performance. Very high values also call for checking the unit, goal and dataset.
8. From interpretation to a quality control plan
Westgard Sigma Rules relate performance, statistical rules and the number of control measurements. Consult the diagram for the number of levels and procedure design. Frequency also depends on sample volume, stability, interventions, consequences of error and applicable requirements; sigma alone does not determine the interval between controls. [7][8]
| Status | Practical action |
|---|---|
| High CV, small bias | Investigate pipetting, mixing, material stability, temperature and instrument repeatability. |
| Low CV, high bias | Check target, unit, method, calibration and lot changes; confirm the hypothesis with independent evidence. |
| Persistently low performance | Assess method suitability for the clinical application. More controls do not repair an unsuitable method. |
| High sigma and a stable series | Review plan efficiency with risk assessment, while retaining IQC, external assessment and manufacturer instructions. |
These are investigation pathways, not diagnoses. If there is evidence of loss of control, follow the procedure for containment, investigation, verification of correction and assessment of potentially affected results. Require evidence of recovery; a passing repeat or high historical sigma does not close the investigation. [8]
9. Monthly review, history and lot changes
A monthly review can form part of periodic IQC assessment; another interval may better fit volume and risk. Reassess after major maintenance, recalibration, lot changes or a persistent chart shift. Record the intervention and compare defined periods using the same specification. [2]
Cumulative history provides context but may dilute recent deterioration. An isolated month is more sensitive to small samples. Show both with observation counts and periods; do not take a simple average of monthly sigma values to obtain cumulative sigma. Recalculate mean, SD and bias from the defined series.
Separate levels, instruments and lots with different targets. When revising the TEa source or version, identify the change: a series recalculated with the new goal does not necessarily represent the decision made at the time. Preserve records needed to reconstruct the assessment.
10. Exercise: why can levels have different sigma values?
Use the illustrated glucose rule, 8% or 6 mg/dL, whichever is greater. Level 1 has target 50 mg/dL, mean 50.5 mg/dL and CV 2%. Level 2 has target 100 mg/dL, mean 101 mg/dL and CV 2%. Performance data are fictional. What is sigma at each level?
See the worked solution
Bias is +1% at both levels. At level 1, 6 mg/dL equals 12%; sigma = (12 − 1) ÷ 2 = 5.5. At level 2, 8% governs; sigma = (8 − 1) ÷ 2 = 3.5. CV and percentage bias are identical; the difference comes from the allowance relative to concentration. Do not choose only the best level to represent the method.
11. Frequently asked questions and interpretation limits
Does sigma 6 mean 3.4 errors per million tests?
Not automatically. That industrial association depends on assumptions, including a 1.5 SD shift and a distribution model. Analytical sigma is not an observed count of incorrect results and does not directly establish patient harm risk. Do not add or subtract 1.5 from the formula without specifying a different model. [9]
Can I assume zero bias if the target is unknown?
Do not present that calculation as a complete sigma assessment. TEa/CV with zero bias is at most a clearly labeled hypothetical scenario. Seek a suitable reference; unassayed material can help estimate imprecision but does not itself provide an independent bias target.
Does sigma replace the Levey-Jennings chart?
No. The chart shows the time sequence, shifts, trends and dispersion. Sigma summarizes data under a specification. Unstable series or mixed populations may produce a misleading summary; examine behavior before classifying.
Does it apply to qualitative tests and every concentration?
This formula uses quantitative results with interpretable means, targets and CVs. Categories such as reactive/nonreactive require other performance measures. Near zero, percentages and CV may become unstable; special scales and quantification limits require their own assessment. Do not force the formula where its assumptions fail.
12. Checklist for your next IQC review
- Select analyte, method, instrument, lot, level and period.
- Justify TEa and record source, version, unit and combination rule.
- Check the bias reference and how well CV data represent routine work.
- Calculate by level without rounding terms before the final result.
- Compare with the chart, external assessment, interventions and clinical risk.
- Record the decision, responsible person, action and next review. Verify that the action delivered sustained improvement.
For more on the components, see:
References used
Sources consulted on September 19, 2026. Numerical performance examples and application checklists are educational. For CLSI documents, the public scope description was consulted; full application requires access to the relevant document.
- Westgard JO. Best Practices for “Westgard Rules”. Westgard QC.
- Westgard SA. Questions from the Sigma Stronger webinar. Westgard QC, 2021.
- Sandberg S et al. Defining analytical performance specifications: Consensus Statement from the 1st Strategic Conference of the EFLM. Clin Chem Lab Med. 2015;53(6):833–835. doi:10.1515/cclm-2015-0067.
- EFLM. Biological Variation Database.
- HHS/CMS. 42 CFR §493.931 — Routine chemistry, Table 2. 2025 edition.
- Westgard SA. Q & A: The basis of bias%? Westgard QC.
- Westgard JO, Westgard SA. Westgard Sigma Rules. Westgard QC, 2014.
- CLSI. EP23: Laboratory Quality Control Based on Risk Management. 2nd ed., 2023.
- Westgard QC. Questioning Six Sigma metrics for the Laboratory.